
Page 35 - Mines and Minerals Reporter eMagazine - Volume October 2021
P. 35
TECHNOLOGY
differences emerged at 600 C, the temperature at which the area of the inner core emerged rapidly. According to the XRD
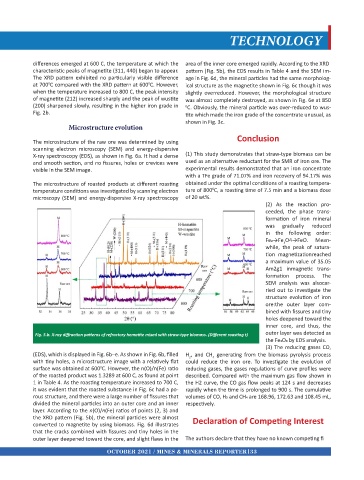
characteristic peaks of magnetite (311, 440) began to appear. pattern (Fig. 5b), the EDS results in Table 4 and the SEM im-
The XRD pattern exhibited no particularly visible difference age in Fig. 6d, the mineral particles had the same morpholog-
0
0
at 700 C compared with the XRD pattern at 600 C. However, ical structure as the magnetite shown in Fig. 6c though it was
when the temperature increased to 800 C, the peak intensity slightly overreduced. However, the morphological structure
of magnetite (212) increased sharply and the peak of wustite was almost completely destroyed, as shown in Fig. 6e at 850
(200) sharpened slowly, resulting in the higher iron grade in C. Obviously, the mineral particle was over-reduced to wus-
0
Fig. 2b. tite which made the iron grade of the concentrate unusual, as
shown in Fig. 3c.
Microstructure evolution
Conclusion
The microstructure of the raw ore was determined by using
scanning electron microscopy (SEM) and energy-dispersive
X-ray spectroscopy (EDS), as shown in Fig. 6a. It had a dense (1) This study demonstrates that straw-type biomass can be
and smooth section, and no fissures, holes or crevices were used as an alternative reductant for the SMR of iron ore. The
visible in the SEM image. experimental results demonstrated that an iron concentrate
with a TFe grade of 71.07% and iron recovery of 94.17% was
The microstructure of roasted products at different roasting obtained under the optimal conditions of a roasting tempera-
0
temperature conditions was investigated by scanning electron ture of 800 C, a roasting time of 7.5 min and a biomass dose
microscopy (SEM) and energy-dispersive X-ray spectroscopy of 20 wt%.
(2) As the reaction pro-
ceeded, the phase trans-
formation of iron mineral
was gradually reduced
in the following order:
Fe2→Fe O4→FeO. Mean-
3
while, the peak of satura-
tion magnetizationreached
a maximum value of 35.05
Am2g 1 inmagnetic trans-
formation process. The
SEM analysis was alsocar-
ried out to investigate the
structure evolution of iron
ore:the outer layer com-
bined with fissures and tiny
holes deepened toward the
inner core, and thus, the
Fig. 5.b. X-ray diffraction patterns of refractory hematite mixed with straw-type biomass. (Different roasting t) outer layer was detected as
the Fe3O4 by EDS analysis.
(3) The reducing gases CO,
(EDS), which is displayed in Fig. 6b–e. As shown in Fig. 6b, filled H , and CH generating from the biomass pyrolysis process
2
4
with tiny holes, a microstructure image with a relatively flat could reduce the iron ore. To investigate the evolution of
surface was obtained at 600 C. However, the n(O)/n(Fe) ratio reducing gases, the gases regulations of curve profiles were
0
of the roasted product was 1.3289 at 600 C, as found at point described. Compared with the maximum gas flow shown in
1 in Table 4. As the roasting temperature increased to 700 C, the H2 curve, the CO gas flow peaks at 124 s and decreases
it was evident that the roasted substance in Fig. 6c had a po- rapidly when the time is prolonged to 900 s. The cumulative
rous structure, and there were a large number of fissures that volumes of CO, H2 and CH4 are 168.96, 172.63 and 108.45 mL,
divided the mineral particles into an outer core and an inner respectively.
layer. According to the n(O)/n(Fe) ratios of points (2, 3) and
the XRD pattern (Fig. 5b), the mineral particles were almost Declaration of Competing Interest
converted to magnetite by using biomass. Fig. 6d illustrates
that the cracks combined with fissures and tiny holes in the
outer layer deepened toward the core, and slight flaws in the The authors declare that they have no known competing fi
OCTOBER 2021 / MINES & MINERALS REPORTER 33