
Page 32 - Mines and Minerals Reporter eMagazine - Volume October 2021
P. 32
TECHNOLOGY
Table 4 EDS component analysis results of corresponding points in Fig. 6.
Element mass (wt.%)
Position n(O)/n(Fe)
Fe O Total
Point 1 69.12 30.88 100.00 1.5637
Point 2 70.15 29.58 100.00 1.4758
Point 3 72.48 27.52 100.00 1.3289
Point 4 72.65 27.35 100.00 1.3176
Point 5 73.00 27.00 100.00 1.2945
Point 6 73.05 26.95 100.00 1.2912
Point 7 73.29 26.71 100.00 1.2755
Point 8 78.83 21.17 100.00 0.9399
Point 9 79.97 20.03 100.00 0.8766
conversion of the alkyl chains and the fragmentation of the
main biomass contents contributed to the release of CO in the
temperature range of 315–400 C, resulting in the early emer-
0
gence of the CO curve [45,46]. The gaseous products were
generated by biomass (Eqs. (1)–(3)), and it was easy to discov-
er that the reducing curves of gaseous CO and H2 decreased
gradually and reached a balance when the roasting time was
varied from 450s (7.5 min) to 900s. The gas flow of CH4 has the
same curve profile as that of CO. It kept increasing until the
peak was reached at 153 s and its maximum was 0.72 mL/s.
Finally, the gas flow of CH4 maintained balance, and its rates
which varied from 0.003 to 0.001 mL/s did not fluctuate. The
cleavage of the _OCH3 side chain in lignin contributed to the
formation of CH4 during the pyrolysis process of biomass [47].
The production of reducing gases was accompanied by the oc-
currence of iron ore reduction reactions. Based on the optimal
roasting time, it was clear that the orderly proceeding of the
magnetic roasting was attributed to the simultaneous release
of the reducing gas.
Fig. 2b demonstrates the cumulative volume regularities of
gaseous production with the addition of straw-type biomass
in the reducing process. Many researchers have investigated
the total gas volume through FTIR (Fourier transform infrared
spectroscopy) by using the Beer-Lambert law, which focuses
on the intensity of transmittance [48,49]. However, the gas
regulations were studied by the synchronous gas analyzer in
this research. The propose of the cumulative gas volume was
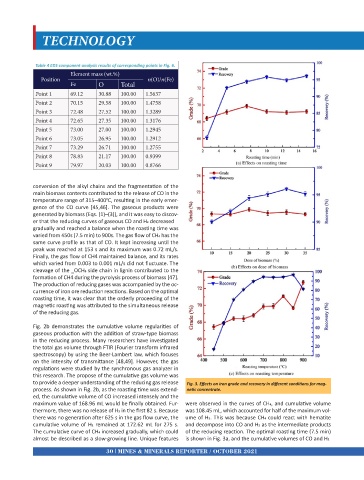
to provide a deeper understanding of the reducing gas release Fig. 3. Effects on iron grade and recovery in different conditions for mag-
process. As shown in Fig. 2b, as the roasting time was extend- netic concentrate.
ed, the cumulative volume of CO increased intensely and the
maximum value of 168.96 mL would be finally obtained. Fur- were observed in the curves of CH4, and cumulative volume
thermore, there was no release of H2 in the first 82 s. Because was 108.45 mL, which accounted for half of the maximum vol-
there was no generation after 625 s in the gas flow curve, the ume of H2. This was because CH4 could react with hematite
cumulative volume of H2 remained at 172.62 mL for 275 s. and decompose into CO and H2 as the intermediate products
The cumulative curve of CH4 increased gradually, which could of the reducing reaction. The optimal roasting time (7.5 min)
almost be described as a slow-growing line. Unique features is shown in Fig. 3a, and the cumulative volumes of CO and H2
30 MINES & MINERALS REPORTER / OCTOBER 2021