
Page 34 - Mines and Minerals Reporter eMagazine - Volume October 2021
P. 34
TECHNOLOGY
min. Although the curves
of roasted products at 7.5
and 10.0 min were nearly
the same, the M value of
S
products at 7.5 min was
slightly higher than that
at 10.0 min. As the roast-
ing time was prolonged,
the MS dropped down to
10.21 Am g at 15.0 min.
2 -1
Hence, the roasting time
of 7.5 min and a tempera-
ture of 800 C were the
0
optimum conditions for
reduction, respectively.
The relationships of mag-
netization and the biomass
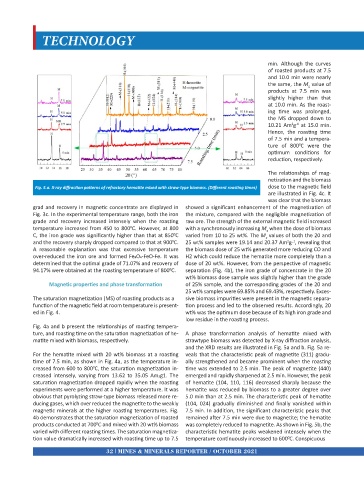
Fig. 5.a. X-ray diffraction patterns of refractory hematite mixed with straw-type biomass. (Different roasting times) dose to the magnetic field
are illustrated in Fig. 4c. It
was clear that the biomass
grad and recovery in magnetic concentrate are displayed in showed a significant enhancement of the magnetization of
Fig. 3c. In the experimental temperature range, both the iron the mixture, compared with the negligible magnetization of
grade and recovery increased intensely when the roasting raw ore. The strength of the external magnetic field increased
temperature increased from 450 to 800 C. However, at 800 with a synchronously increasing M when the dose of biomass
0
S
C, the iron grade was significantly higher than that at 850 C varied from 10 to 25 wt%. The M values of both the 20 and
0
S
and the recovery sharply dropped compared to that at 900 C. 25 wt% samples were 19.14 and 20.37 Am g , revealing that
0
2 _1
A reasonable explanation was that excessive temperature the biomass dose of 25 wt% generated more reducing CO and
over-reduced the iron ore and formed Fe3O4-FeO-Fe. It was H2 which could reduce the hematite more completely than a
determined that the optimal grade of 71.07% and recovery of dose of 20 wt%. However, from the perspective of magnetic
94.17% were obtained at the roasting temperature of 800 C. separation (Fig. 4b), the iron grade of concentrate in the 20
0
wt% biomass dose sample was slightly higher than the grade
Magnetic properties and phase transformation of 25% sample, and the corresponding grades of the 20 and
25 wt% samples were 69.85% and 69.43%, respectively. Exces-
The saturation magnetization (MS) of roasting products as a sive biomass impurities were present in the magnetic separa-
function of the magnetic field at room temperature is present- tion process and led to the observed results. Accordingly, 20
ed in Fig. 4. wt% was the optimum dose because of its high iron grade and
low residue in the roasting process.
Fig. 4a and b present the relationships of roasting tempera-
ture, and roasting time on the saturation magnetization of he- A phase transformation analysis of hematite mixed with
matite mixed with biomass, respectively. strawtype biomass was detected by X-ray diffraction analysis,
and the XRD results are illustrated in Fig. 5a and b. Fig. 5a re-
For the hematite mixed with 20 wt% biomass at a roasting veals that the characteristic peak of magnetite (311) gradu-
time of 7.5 min, as shown in Fig. 4a, as the temperature in- ally strengthened and became prominent when the roasting
creased from 600 to 800 C, the saturation magnetization in- time was extended to 2.5 min. The peak of magnetite (440)
0
creased intensely, varying from 13.62 to 35.05 Am2g 1. The emerged and rapidly sharpened at 2.5 min. However, the peak
saturation magnetization dropped rapidly when the roasting of hematite (104, 110, 116) decreased sharply because the
experiments were performed at a higher temperature. It was hematite was reduced by biomass to a greater degree over
obvious that pyrolyzing straw-type biomass released more re- 5.0 min than at 2.5 min. The characteristic peak of hematite
ducing gases, which over reduced the magnetite to the weakly (104, 024) gradually diminished and finally vanished within
magnetic minerals at the higher roasting temperatures. Fig. 7.5 min. In addition, the significant characteristic peaks that
4b demonstrates that the saturation magnetization of roasted remained after 7.5 min were due to magnetite; the hematite
products conducted at 700 C and mixed with 20 wt% biomass was completely reduced to magnetite. As shown in Fig. 5b, the
0
varied with different roasting times. The saturation magnetiza- characteristic hematite peaks weakened intensely when the
tion value dramatically increased with roasting time up to 7.5 temperature continuously increased to 600 C. Conspicuous
0
32 MINES & MINERALS REPORTER / OCTOBER 2021