
Page 12 - Mines and Minerals Reporter eMagazine - Volume October 2021
P. 12
INDUSTRY ANALYSIS
Computation of auction payment:
Monthly auction payment
= quantity of mineral despatched
× Average Sale Price of mineral (by state and grade)
× percentage quoted in auctions
Captive miners may sustain such a business model by absorbing
losses from mining activities in their downstream businesses.
In contrast, merchant miners will have to find ways to remain
competitive. High bids in auctions result in inefficiencies in the
economy. Captive miners may choose to only mine as per their
requirements which might distort open market prices to their
competitive advantage. Additionally, high bidders, hit by the
‘winners’ curse’, may not even start mining operations. Fur-
ther, mining companies may attempt to cut corners in environ-
mental protection or community welfare, given the high pre-
miums they have committed to the government in auctions.
Many iron-ore mines have been auctioned at high premiums.
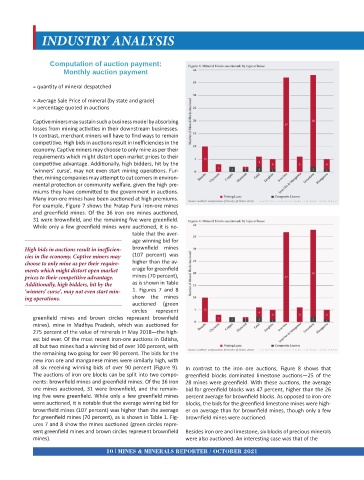
For example, Figure 7 shows the Pratap Pura iron-ore mines
and greenfield mines. Of the 36 iron ore mines auctioned,
31 were brownfield, and the remaining five were greenfield.
While only a few greenfield mines were auctioned, it is no-
table that the aver-
age winning bid for
High bids in auctions result in inefficien- brownfield mines
cies in the economy. Captive miners may (107 percent) was
choose to only mine as per their require- higher than the av-
ments which might distort open market erage for greenfield
prices to their competitive advantage. mines (70 percent),
Additionally, high bidders, hit by the as is shown in Table
‘winners’ curse’, may not even start min- 1. Figures 7 and 8
ing operations. show the mines
auctioned (green
circles represent
greenfield mines and brown circles represent brownfield
mines). mine in Madhya Pradesh, which was auctioned for
275 percent of the value of minerals in May 2018—the high-
est bid ever. Of the most recent iron-ore auctions in Odisha,
all but two mines had a winning bid of over 100 percent, with
the remaining two going for over 90 percent. The bids for the
new iron ore and manganese mines were similarly high, with
all six receiving winning bids of over 90 percent (Figure 9). In contrast to the iron ore auctions, Figure 8 shows that
The auctions of iron ore blocks can be split into two compo- greenfield blocks dominated limestone auctions—25 of the
nents: brownfield mines and greenfield mines. Of the 36 iron 28 mines were greenfield. With these auctions, the average
ore mines auctioned, 31 were brownfield, and the remain- bid for greenfield blocks was 47 percent, higher than the 26
ing five were greenfield. While only a few greenfield mines percent average for brownfield blocks. As opposed to iron-ore
were auctioned, it is notable that the average winning bid for blocks, the bids for the greenfield limestone mines were high-
brownfield mines (107 percent) was higher than the average er on average than for brownfield mines, though only a few
for greenfield mines (70 percent), as is shown in Table 1. Fig- brownfield mines were auctioned.
ures 7 and 8 show the mines auctioned (green circles repre-
sent greenfield mines and brown circles represent brownfield Besides iron ore and limestone, six blocks of precious minerals
mines). were also auctioned. An interesting case was that of the
10 MINES & MINERALS REPORTER / OCTOBER 2021