
Page 22 - Mines and Minerals Reporter eMagazine - Volume October 2021
P. 22
TECHNOLOGY
As part of this, bids have been invited for coal capacity over
225 Mt from which the government anticipates generation Surface Underground Mining
of US$4.5 billion in rev- Mining Degree-I Degree-II Degree-III
enue. The government Mining emission factor (m3/t-coal) 1.18 2.91 13.08 23.68
has termed the recent Post-mining emission factor (m3/t-coal 0.15 0.98 2.15 3.12
auction policy as fair
based on the payment Total methane emissions (kg-CO2e/t-coal) 24.95 72.98 285.71 502.77
and land ownership Total methane emissions (kg-CO2e/kWh) 0.02 0.05 0.19 0.33
policies. This could in- Share of methane in total GHG emissions (%) 1.66 4.71 16.21 25.40
crease coal extraction
and associated envi- Table 1. Mining and post-mining emission factors for Indian coal sector (Singh and Kumar, 2016) with estimated share
of methane emissions in overall coal life cycle. Assumed global warming potential of methane is 28 over a 100-year
ronmental emissions. time horizon.
Alternatively, healthy
competition in the coal sector could also give rise to more players. At the same time, both ONGC and Coal India Limited
efficient and sustainable practices. It could be noted that 14 have significant methane resources in their command areas.
out of 38 mining blocks were not taken up. Thus, it remains These resources (largely occurring in the states of West Bengal
to be seen whether the coal auction strategies will pay divi- and Jharkhand) would be fed into the newly-inaugurated Urja
dends. Third, the NITI Aayog and other policy-relevant bodies Ganga pipeline (Kelafant, 2020). While these developments
of the government have placed a very high emphasis on the are at different levels of readiness, there is a need to under-
diversification of the end use of coal. This includes an import- stand their impacts on the different stakeholders in the coal
ant thrust on gasification and creation of a ‘methanol econ- sector.
omy’. The government could likely move ahead with a policy
for 15% methanol blending with transport fuel which could This article aims to summarize the key technological facets for
result in cost savings of $8 billion annually (Saraswat and Ban- reduction of greenhouse gas (GHG) emissions from the Indi-
sal, 2016). Recently, Coal India Limited has indicated its intent an coal sector. It also seeks to provide the current status and
to commission a coal-based methanol plant. In a similar vein, future opportunities at a systems-scale for decarbonization of
there have been some initial efforts to capitalize on under- the coal sector in the near and medium term.
ground coal gasification (UCG) both from CIL as well as pri-
vate sector businesses. These plans towards diversification of Emissions from the
coal use have been repeatedly discussed by the government.
But diversification of the fossil fuel sector has been challeng- coal life cycle in India
ing as evidenced by the slowing down of such plans by Saudi
Aramco, the world’s largest oil producing company. Diversi- In this section, we discuss the key elements of a decarboniza-
fication of coal may be more challenging because of higher tion strategy for the coal sector. The majority of the emissions
emission intensity and less alternatives available than liquid in the coal supply chain come from coal combustion for power
hydrocarbons (McJeon et al, 2021). Fourth, in addition to coal generation. Some emissions are also attributable for coal uti-
end-use diversification, coalbed methane or CBM extraction lization in non-power sectors. Overall, coal oxidation results
in India has also increased significantly. The current CBM ex- in 65% of the CO emissions in India (Andrew, 2020; MOEFCC,
2
traction in India exceeds 45 MMSCFD largely through private 2020). Fugitive emissions of methane during mining and
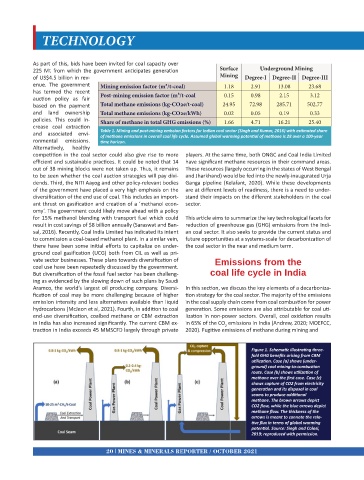
Figure 1. Schematic illustrating three-
fold GHG benefits arising from CBM
utilization. Case (a) shows (under-
ground) coal mining-to-combustion
route. Case (b) shows utilization of
methane over the first case. Case (c)
shows capture of CO2 from electricity
generation and its disposal in coal
seams to produce additional
methane. The brown arrows depict
CO2 flow, while the blue arrows depict
methane flow. The thickness of the
arrows is meant to connote the rela-
tive flux in terms of global warming
potential. Source: Singh and Colosi,
2019; reproduced with permission.
20 MINES & MINERALS REPORTER / OCTOBER 2021